|
JOIN OUR MAILING LIST |
{{item.currency}} {{pricing}} - Out of Stock
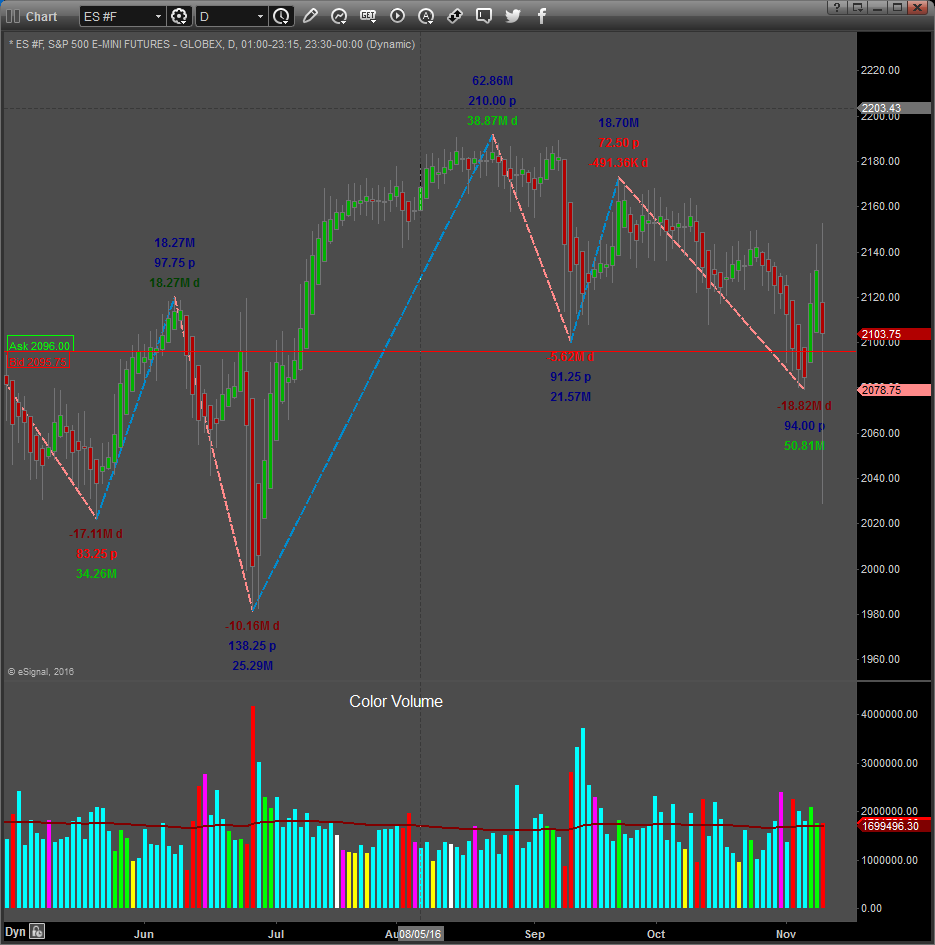
Volume bars is very difficult to interpret bar by bar. We developed an oscillator showing volume flow and Buying and Selling pressure that is easy to read and show much more details than volume bars. A lot of bar to bar noise are eliminated and nullified with this oscillator.
Watch out for divergences between this oscillator and price bars, as volume is a leading indicator (leading price). Where volume is positive (buying) the zero line is green and red where it is negative (selling). A purple dot is plotted where there is a volume bar spike. You can choose the factor ( i.e 3 times larger than previous bar etc.) which must be used to calculate the volume spike. You can turn this future on or off'. Volume spikes come in handy especially on intraday charts and bars where this change in volume took place, is clearly identified.
The background is also colored according to buying and selling volume flow. Dark pink when volume is negative and negativity increase (more selling). Light pink when volume is negative and negativity decrease (buyng). Dark blue when volume is positive and buying is increasing. Lightblue when volume is positive and selling increase.


